BPMN Template
Manage operations at ease with the BPMN template. Bring agility to your team and improve communication, showing your business process graphically.
Trusted by 65M+ users and leading companies


About the BPMN Template
BPMN, or Business Process Modeling Notation, is a method that project managers, business analysts, and other professionals can use to visualize end-to-end operations of a business process. BPMN diagrams use a standardized notation to represent processes, leading to better alignment and shared understanding.
Using a BPMN template can be your starting point when diagramming your organization’s business processes. You can also use Miro's BPMN tool to diagram from scratch if that is better suited to your needs.
What is the BPMN Template?
The BPMN template graphically shows your business process using standardized notations. This can be anything from recruitment to sales management.
The BPMN diagram template helps you build an overview of all the necessary steps needed to complete a business process and avoid miscommunication between teams and stakeholders. For that reason, it’s an excellent tool to bring agility to your team and move your projects forward.
When to use the BPMN Template
You can use the BPMN template to easily organize and keep track of your business process, keep everyone in the loop, and avoid misunderstandings.
Project managers can use the BPMN template to keep track of the process flow and identify any bottlenecks or unnecessary steps. Business analysts can use the template to create a BPMN diagram to track performance and identify opportunities. Many other professionals also use it to easily manage their business and keep their team’s efficiency high.
How to use the BPMN Template
You can use our BPMN template and edit it according to your organization’s needs. No matter the type of business or process you are mapping, there are some common considerations for all BPMN diagrams.
Here are some fundamentals found in the BPMN template:
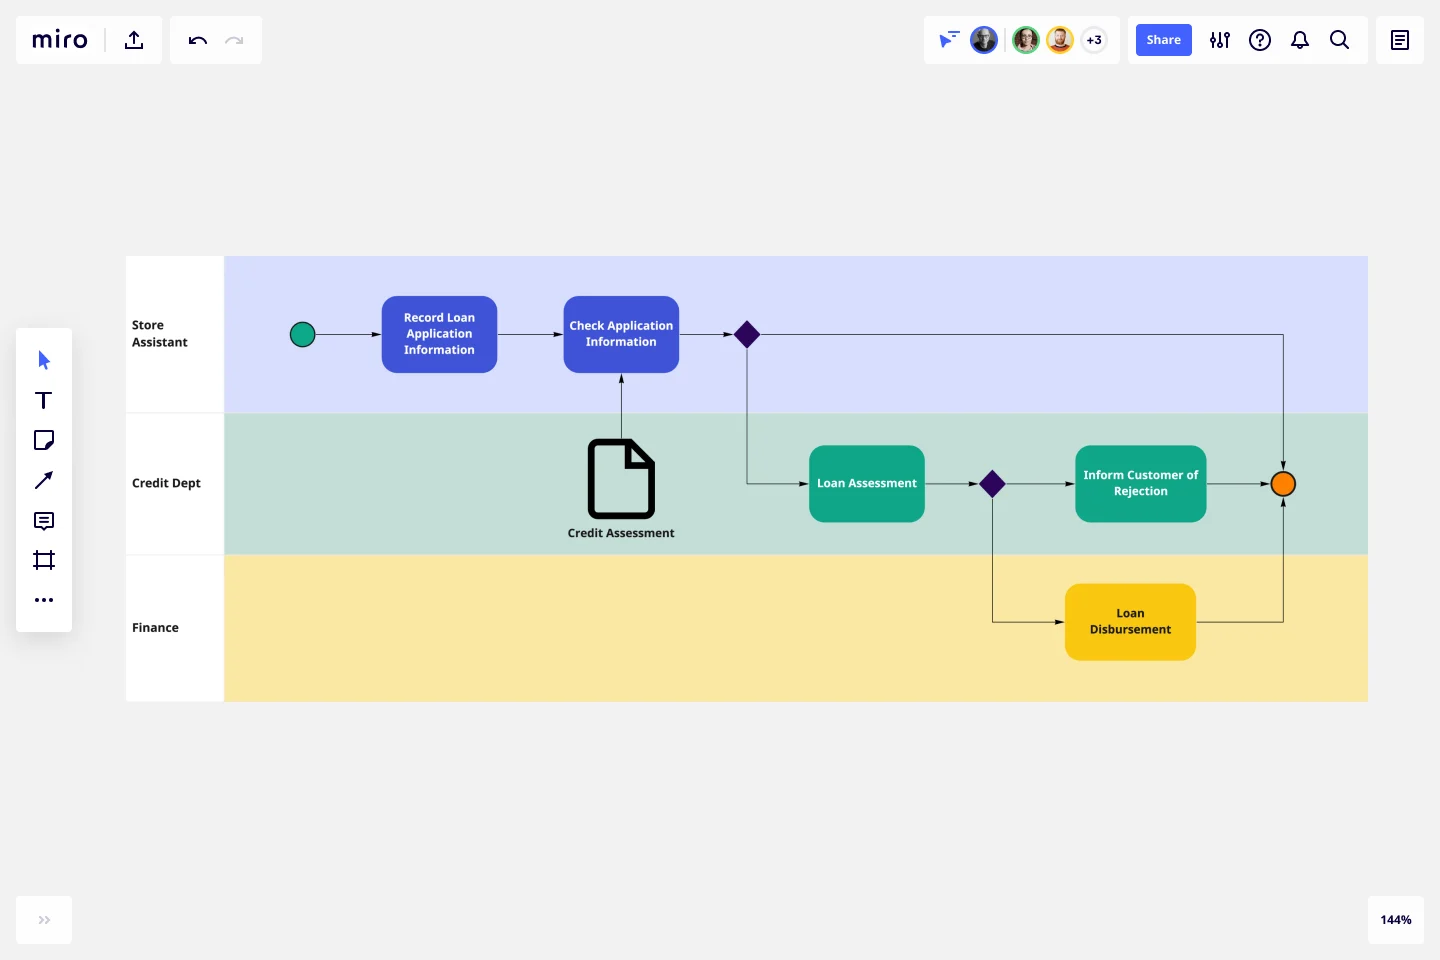
1. Swimlanes for each participant or department
The template is set up using swimlanes, which can be used to represent different departments or teams. That way, you quickly see which functions are involved in each step and what they are accountable for.
2. Symbols and objects to identify flows
Objects in the BPMN template can signal flows, events, or activities. For example, rectangles represent actions or activities in the flow. Diamonds show that the flow can go in several directions. Circles represent the beginning, end, or change in the process.
3. Connection between the objects
Use arrows to connect the flow objects. Solid arrow lines represent a sequence (the order in which actions need to be taken). Dashed line arrows represent information shared between departments. Dotted line arrows show that a note is associated with a particular event or step.
4. Add artifacts
You can add extra information in case you need more details in one step or action. The artifacts can be about data or annotations about any given process step.
The advantages of using a BPMN template are that you can communicate with technical and non-technical stakeholders. Using a standard notation makes it easy to convey information to various teams implementing your business process.
Because the BPMN process flow diagram is easy to understand, project managers and business analysts can use this template to manage cross-functional teams and departments.
How do I create a BPMN diagram?
Creating a BPMN diagram in Miro is easy. You can start using the BPMN template and edit to customize it according to your needs. Before starting working on your BPMN diagram, be sure that you have determined the purpose of your diagram. What do you want to achieve with this business process? Secondly, make a list of all the steps and assign roles/departments to actions. After your process is defined, you can implement and track it. The BPMN diagram is where you can see any bottlenecks or unnecessary steps or departments involved. Make it a living document, a source of information that you can always consult and edit if necessary.
What is a BPMN diagram used for?
Many professionals use the BPMN diagram to track and monitor business processes effectively, get an overview the whole flow, avoid miscommunication across departments, and quickly identify any constraints or processes bottlenecks.
Get started with this template right now.
Design Research Template
Works best for:
UX Design, Design Thinking, Desk Research
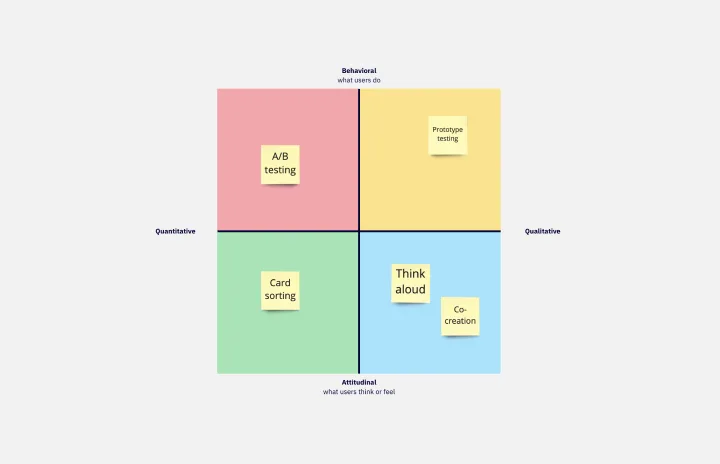
A design research map is a grid framework showing the relationship between two key intersections in research methodologies: mindset and approach. Design research maps encourage your team or clients to develop new business strategies using generative design thinking. Originally designed by academic Liz Sanders, the framework is meant to resolve confusion or overlap between research and design methods. Whether your team is in problem-solving or problem space definition mode, using a research design template can help you consider the collective value of many unrelated practices.
SAFe Program Template
Works best for:
Agile Methodology, Diagrams, Agile Workflows
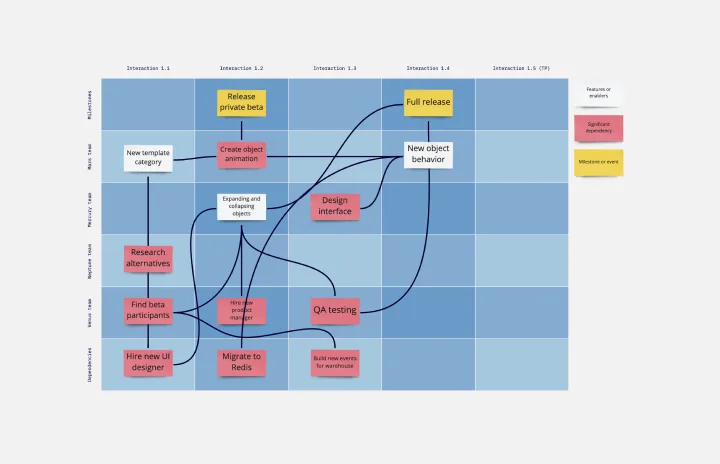
Many organizations use the Agile model, but even companies that don’t rigorously adhere to all Agile standards have adopted Agile tools and methods like Program Increment (PI) Planning. Even if you’re not participating in a formal PI session, a program board can be a great way to establish communication across teams and stakeholders, align development objectives with business goals, clarify dependencies, and foster cross-functional collaboration. The board provides much-needed structure to planning sessions, yet is adaptable enough to accommodate brainstorming and alignment meetings.
Inverted Org Chart Template
Works best for:
Org Charts, Organizational Design
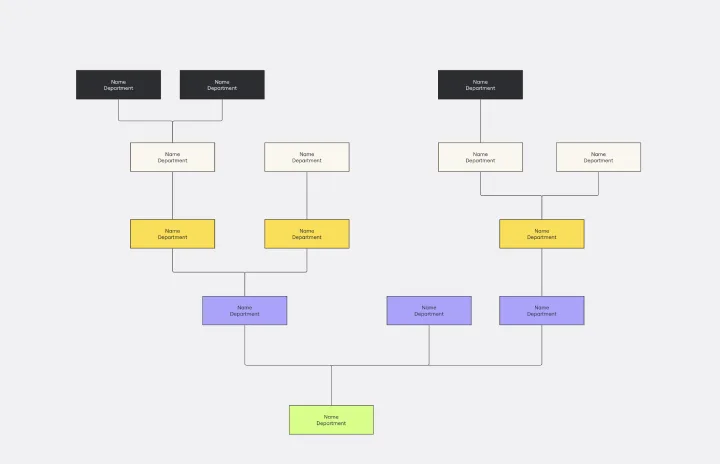
The Inverted Org Chart Template is a tool that reimagines the traditional hierarchical model by placing frontline employees at the top of the organizational structure. This innovative approach highlights the crucial role played by those who interact with customers directly, ensuring that their insights and contributions are not only recognized but also celebrated. One of the key advantages of this template is that it fosters a feedback-driven environment. Prioritizing frontline workers promotes a culture where valuable insights from the ground can quickly reach the top of the hierarchy, streamlining decision-making processes and ensuring that strategies are based on real-world experiences.
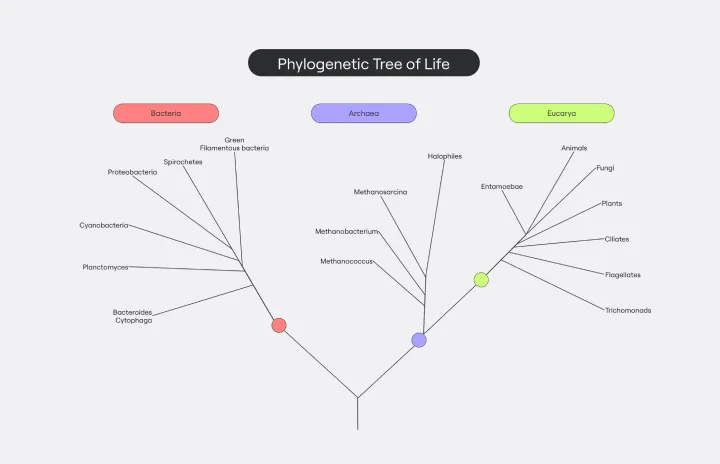
Phylogenetic Tree Template
Works best for:
Diagramming
The Phylogenetic Tree Template is a powerful tool that allows scientists and researchers to visualize evolutionary relationships between species. It is a visual representation of the history of the evolution of life on Earth and helps users identify the relationships between other organisms and their ancestors. The key benefit of this template is that it organizes complex data and makes it more understandable to everyone. Additionally, it offers an efficient way to collect and analyze data, saving time and effort and enabling users to identify significant patterns and relationships in the data.
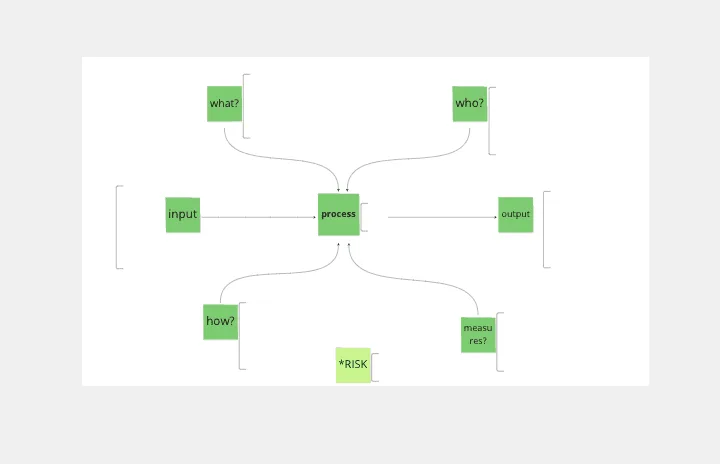
Turtle Diagram for BA
Works best for:
Diagramming
The Turtle Diagram for BA template offers a visual framework for defining and auditing business processes according to ISO 9001 standards. It provides elements for documenting process inputs, outputs, activities, and controls. This template enables organizations to ensure compliance, identify process improvements, and enhance quality management practices. By promoting systematic process documentation and auditability, the Turtle Diagram for BA empowers organizations to achieve and maintain ISO 9001 certification, demonstrating commitment to quality and continuous improvement.
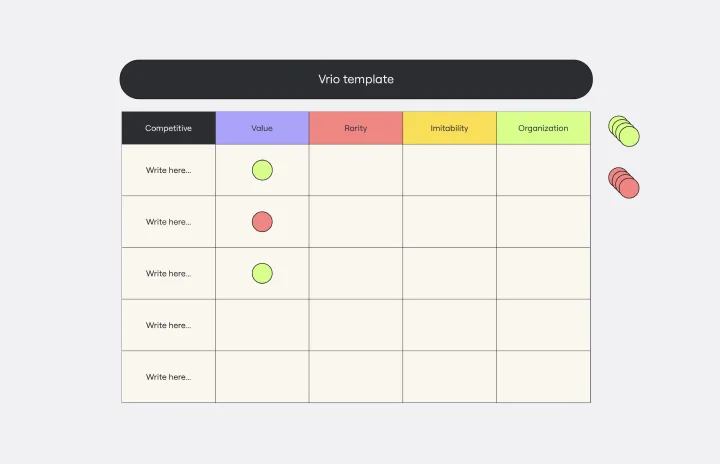
VRIO Analysis Template
Works best for:
Diagramming, Strategy
The VRIO Analysis Template is a framework that helps businesses evaluate their resources and capabilities for competitive advantage. It categorizes resources into four areas: Value, Rarity, Imitability, and Organization. This provides a comprehensive view of an organization's strengths and potential weaknesses. The template has the key benefit of offering quick visual insights. Decision-makers can immediately identify and focus on resources that are valuable, rare, hard to imitate, and well-organized. This ensures a sustainable competitive edge and saves time by avoiding lengthy textual analyses.