Likert Scale Template
Use our 5 (or 7) Point Likert Scale to measure attitudes, knowledge, values and opinions with a greater degree of nuance.
Trusted by 65M+ users and leading companies


About the Likert Scale Template
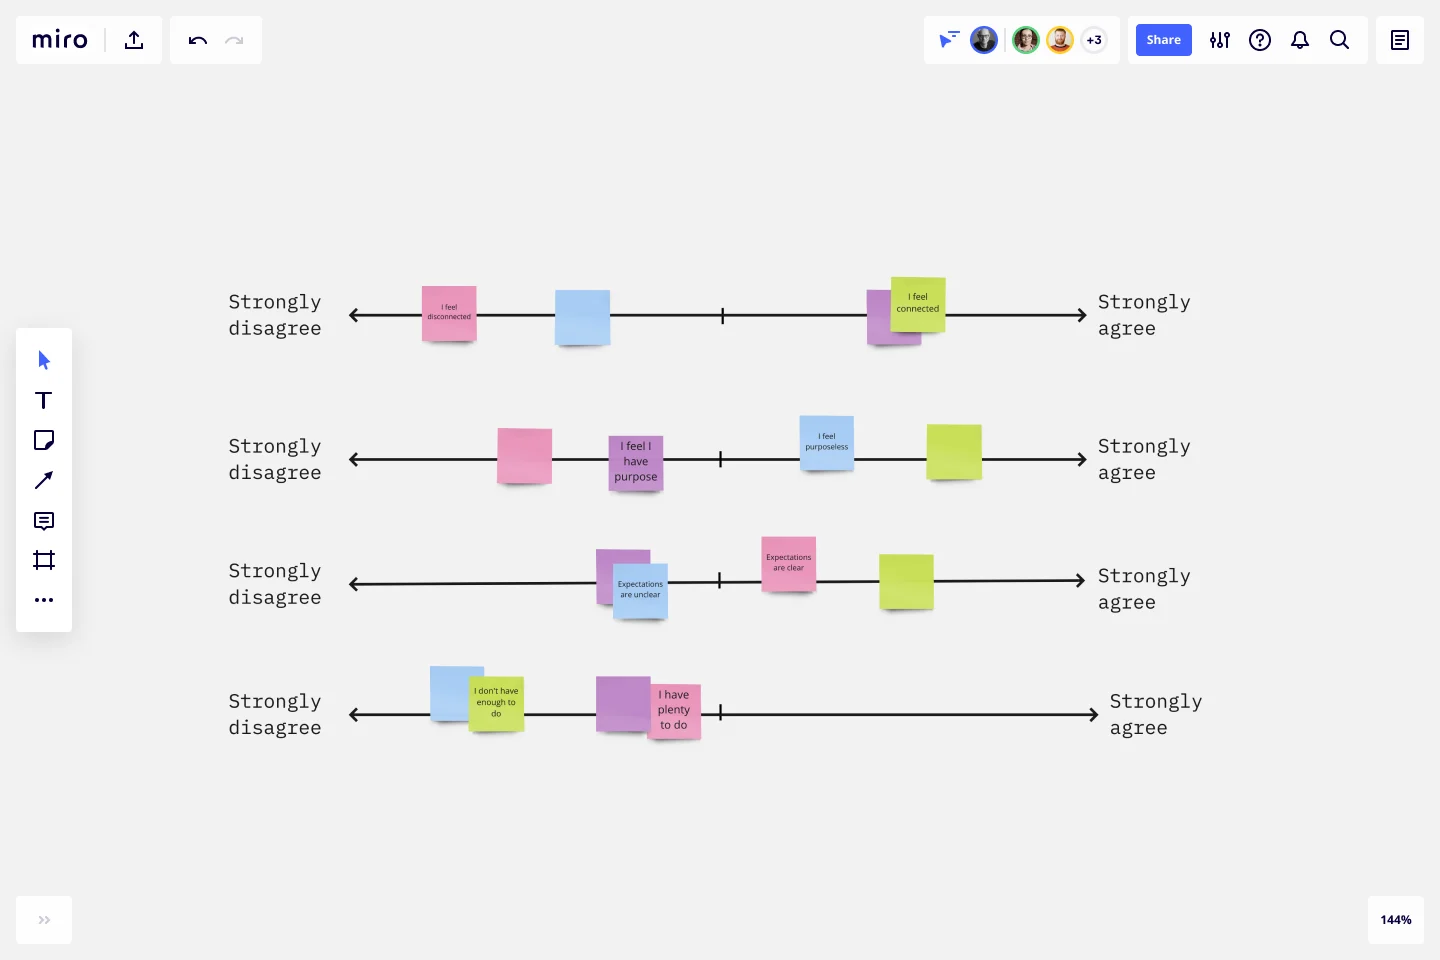
The Likert scale is a rating system you can use to measure complex, subjective data such as how people feel about your product, service, or experience. This template makes it easy to conduct user interviews and gather feedback.
With the Likert scale template, users can pick out a possible response to a statement or question that’s either expressed in words or numbers.
Examples of responses include a range such as “strongly agree,” “neutral,” “agree,” “disagree” or “strongly disagree,” or “strongly satisfied” to “strongly dissatisfied.”
You can also use numbers, such as 1 = “strongly agree,” 2 = “agree,” and so on.
Tips for using the Likert scale template
The Likert scale is either a five (or seven) point scale of response options that asks your customer or interview subject to agree or disagree with a statement.
The scale assumes that the intensity of someone’s attitude or opinion is linear, ranging from strongly agree to strongly disagree, and assumes that attitudes can be measured.
For example, each of the five (or seven) responses would either be counted in terms of how often a sentiment was expressed or have a numerical value that would be used to measure the attitude being explored.
Likert data can be a reliable source to point to how people think and feel, as long as you’re aware of the when-in-doubt-just-agree tendency.
To reduce the impact of this bias, researchers can...
Phrase questions as statements: presenting facts for customers to align with (or reject) can offer insight into different pieces of your business. Accordingly, the score averages give you a general measure of satisfaction that you can track over time and try to improve.
Include and evaluate both positive and negative statements, in pairs, for consistency: instead of measuring one-off sentiments, see if your customers are reliably in agreement, disagreement, or neutral in more than one instance.
When to use the Likert scale template
Researchers across disciplines, from UX to marketing to customer experience, can use a Likert scale to measure statements of agreement.
Depending on your product, service, or experience, the scale can also be used to measure:
Agreement: Strongly agree → Strongly disagree
Frequency: Often → Never
Quality: Very good → Very bad
Likelihood: Definitely → Never
Importance: Very important → Unimportant
To get a more accurate measurement of everyone’s responses, it’s worth asking people to agree or disagree with multiple statements. You can then combine or average a person’s responses.
How to use the Likert scale template
Get started by selecting the Likert scale template, then take the following steps to make one of your own:
Decide what you’d like to measure. This is the foundation for your research. Ensure that what you’re measuring can be scaled on the strength of opinions, attitudes, feelings, or experiences. Customers should see two clear extremes (positive and negative) and a neutral midpoint.
Create or edit the indicator statements or questions. The scale works best when you’re trying to find customer insights that can’t be understood with just one answer. An example statement could be, “The number of items on the takeaway menu overwhelms me.” Every statement (or each question) is trying to dig into what your customer actually feels.
Decide on Likert response scales. At a minimum, you can aim for a 5-point scale. At maximum, a 7-point scale. Any less or any more can compromise readability. Choose simple, clear language with different categories, such as “Agree - Disagree,” “Helpful - Not Helpful,” “Always - Never.” You can add or delete sticky notes (which can act as points and categories) accordingly.
Pre-test with your team. Share the Miro board with your team to test any unclear questions, awkwardly worded statements, or duplicate categories. Ask your team if every element on the scale can help you gather actionable feedback. If not, revise or delete that element.
Test (and re-test) as needed. Invite participants onto your board and ask them to respond to each statement or question. Data collection should be a process that you keep fine-tuning over time. Start with a small sample group of participants representing a larger group you’re trying to learn about. Refine – or expand – your point scale and category language as you get user feedback and calculate results.
Organize and import Likert Scale survey results visually from other sources. Import survey results as needed on your Miro board, to share and review with your team.
Get started with this template right now.
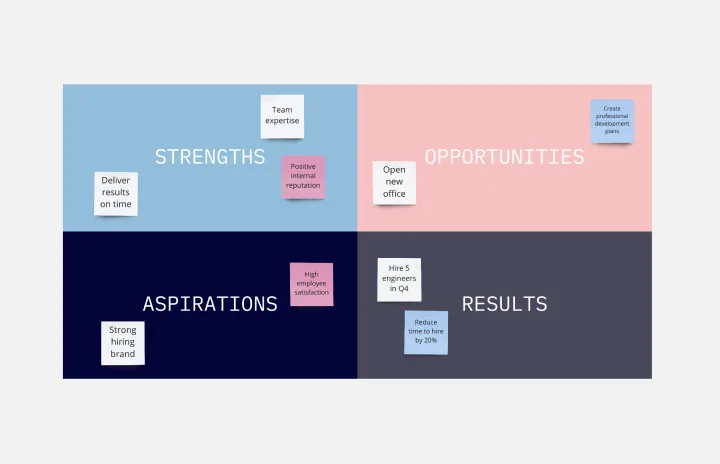
SOAR Analysis Template
Works best for:
Leadership, Decision Making, Strategic Planning
The SOAR Analysis template prompts you to consider your organization’s strengths and potential to create a shared vision of the future. The SOAR Analysis is unique in that it encourages you to focus on the positive rather than solely identifying areas for growth. SOAR stands for Strengths, Opportunities, Aspirations, and Results. To use the template, examine each category through a positive lens. Perform a SOAR Analysis whenever you want to bring people together and encourage action.
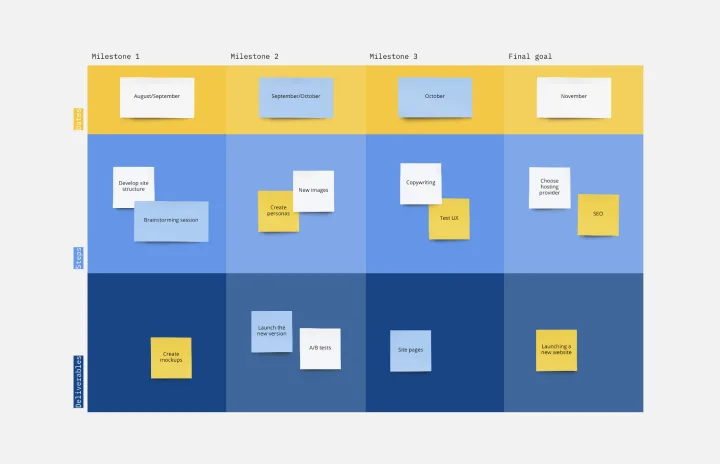
Milestone Chart Template
Works best for:
Project Management, Strategic Planning, Project Planning
When your team is collaborating on a large project, keeping track of the many tasks and multiple timelines can be a challenge. That’s why you need a milestone chart. These visual representations of important project events will make it simple for your team to stay on schedule and reach goals on time. And it’s so easy to get started — just determine the major milestones, use our template to create a milestone chart, and define the key dates and deliverables each milestone will require.
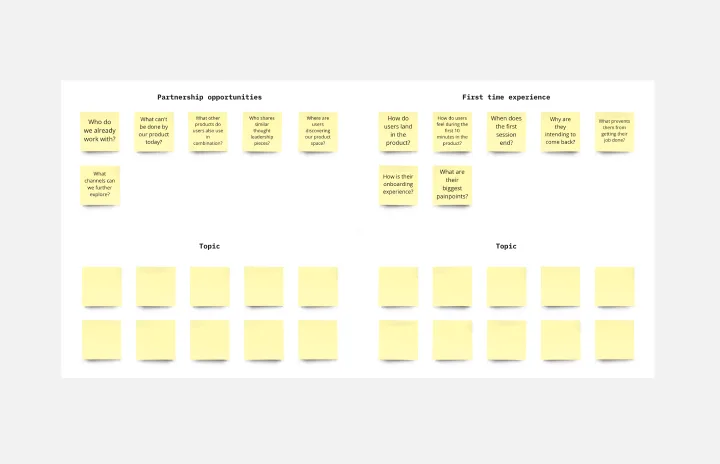
Research Topic Brainstorm Template
Works best for:
Desk Research, Brainstorming, Ideation
Coming up with a topic for a research project can be a daunting task. Use the Research Topic Brainstorm template to take a general idea and transform it into something concrete. With the Research Topic Brainstorm template, you can compile a list of general ideas that interest you and then break them into component parts. You can then turn those parts into questions that might be the focus for a research project.
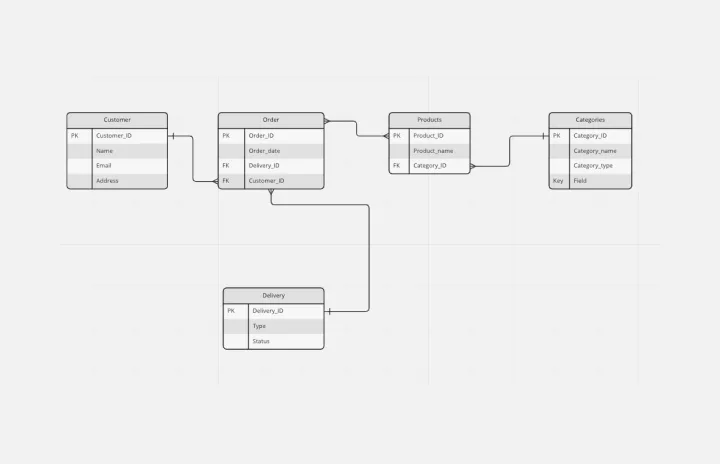
Entity Relationship Diagram Template
Works best for:
Flowcharts, Strategic Planning, Diagrams
Sometimes the most important relationships in business are the internal ones—between the teams, entities, and actors within a system. An entity relationship diagram (ERD) is a structural diagram that will help you visualize and understand the many complex connections between different roles. When will an ERD come in handy? It’s a great tool to have for educating and onboarding new employees or members of a team, and our template makes it so easy to customize according to your unique needs.
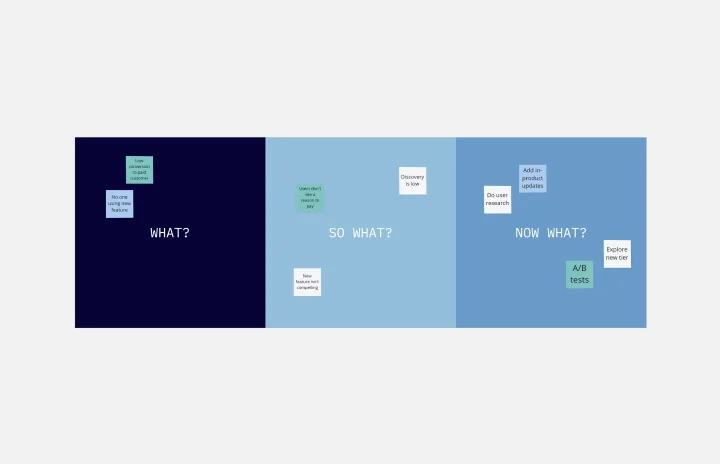
What? So What? Now What? Template
Works best for:
Agile Workflows, Retrospectives, Brainstorming
The What? So What? Now What? Framework empowers you to uncover gaps in your understanding and learn from others’ perspectives. You can use the What? So What? Now What? Template to guide yourself or a group through a reflection exercise. Begin by thinking of a specific event or situation. During each phase, ask guiding questions to help participants reflect on their thoughts and experience. Working with your team, you can then utilize the template to record your ideas and to guide the experience.
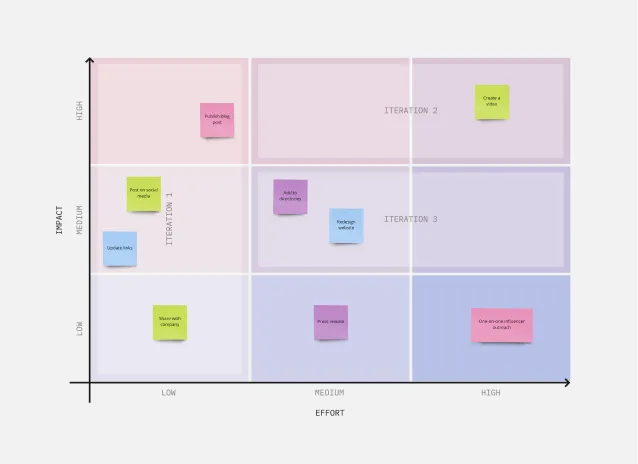
3x3 Prioritization Method Template
Works best for:
Operations, Prioritization, Strategic Planning
It’s all about assessing a task or idea, and quickly deciding the effort it will take and the potential impact it will have—ranked low, medium, or high. That’s what the 3x3 prioritization method does: Help teams prioritize and identify quick wins, big projects, filler tasks, or time-wasters. With nine bucket areas, it offers slightly greater detail than the 2x2 Prioritization Matrix (or Lean Prioritization Method). It’s easy to make your own 3x3 prioritization matrix—then use it to determine what activities or ideas to focus on with your valuable resources.